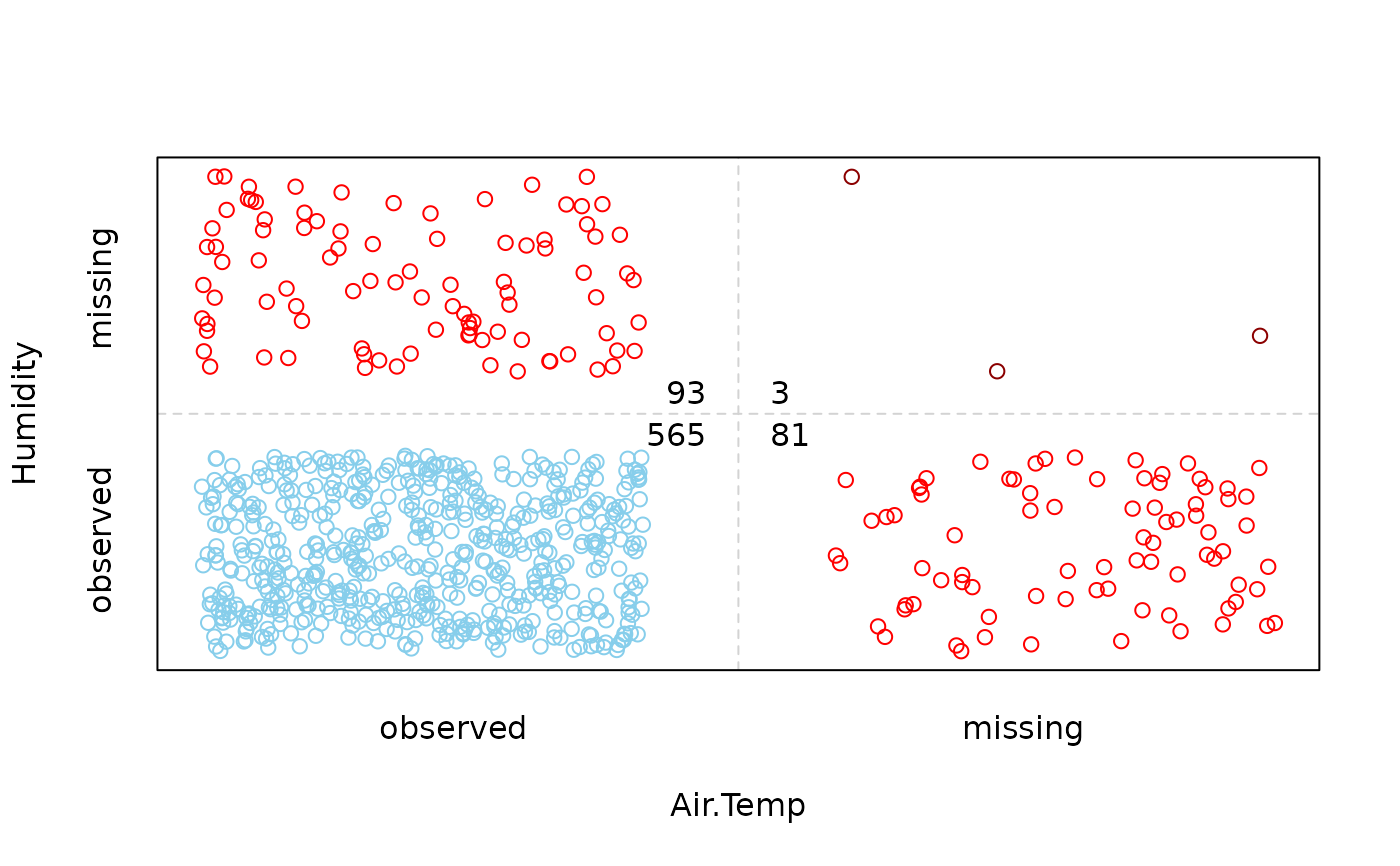
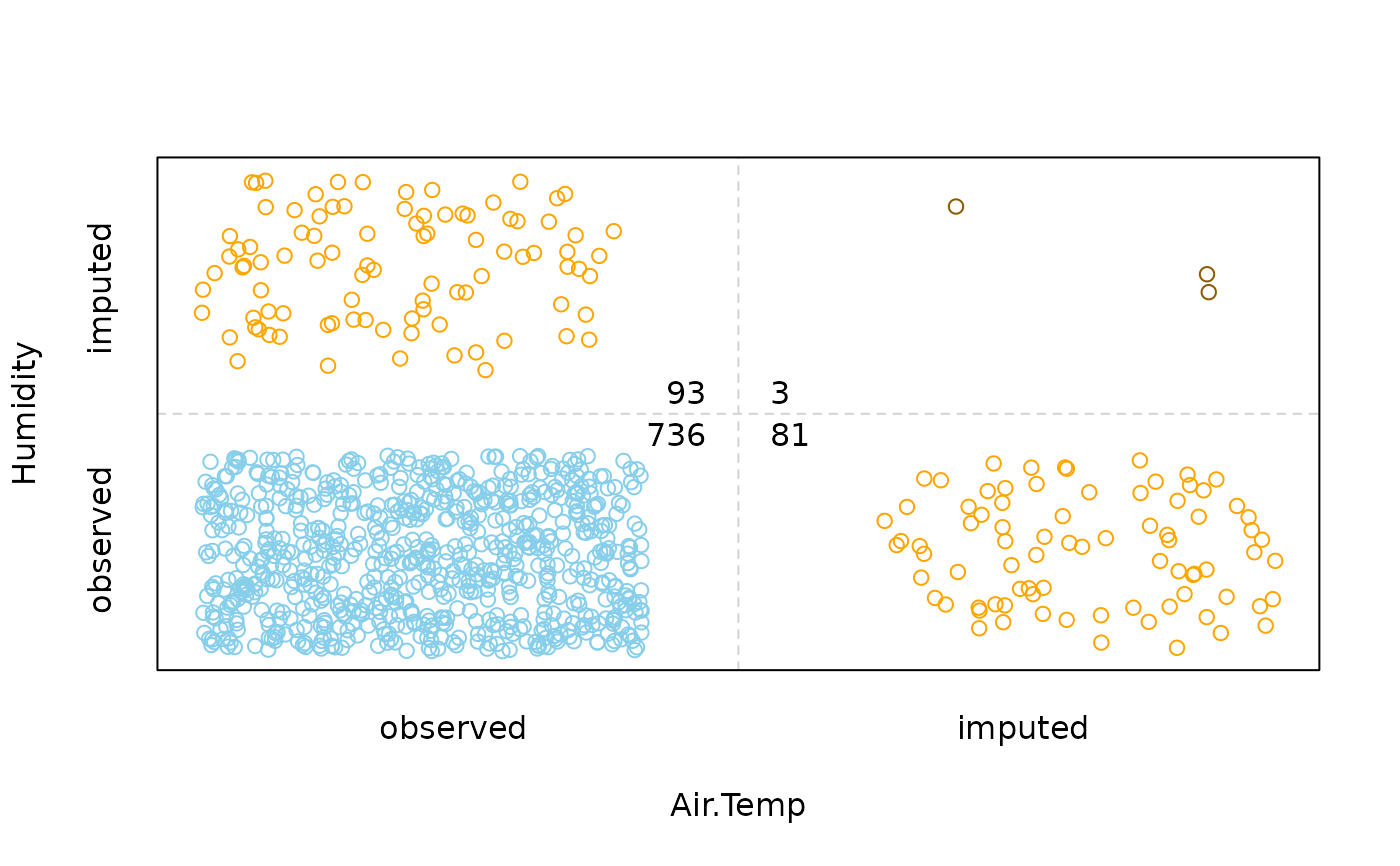
Create a bivariate jitter plot.
scattJitt(
  x,
  delimiter = NULL,
  col = c("skyblue", "red", "red4", "orange", "orange4"),
  alpha = NULL,
  cex = par("cex"),
  col.line = "lightgrey",
  lty = "dashed",
  lwd = par("lwd"),
  numbers = TRUE,
  cex.numbers = par("cex"),
  main = NULL,
  sub = NULL,
  xlab = NULL,
  ylab = NULL,
  axes = TRUE,
  frame.plot = axes,
  labels = c("observed", "missing", "imputed"),
  ...
)
Arguments
- x
a
data.frameormatrixwith two columns.- delimiter
a character-vector to distinguish between variables and imputation-indices for imputed variables (therefore,
xneeds to havecolnames()). If given, it is used to determine the corresponding imputation-index for any imputed variable (a logical-vector indicating which values of the variable have been imputed). If such imputation-indices are found, they are used for highlighting and the colors are adjusted according to the given colors for imputed variables (seecol).- col
a vector of length five giving the colors to be used in the plot. The first color will be used for complete observations, the second/fourth color for missing/imputed values in only one variable, and the third/fifth color for missing/imputed values in both variables. If only one color is supplied, it is used for all. Else if two colors are supplied, the second one is recycled.
- alpha
a numeric value between 0 and 1 giving the level of transparency of the colors, or
NULL. This can be used to prevent overplotting.- cex
the character expansion factor for the plot characters.
- col.line
the color for the lines dividing the plot region.
- lty
the line type for the lines dividing the plot region (see
graphics::par()).- lwd
the line width for the lines dividing the plot region.
- numbers
a logical indicating whether the frequencies of observed and missing/imputed values should be displayed (see ‘Details’).
- cex.numbers
the character expansion factor to be used for the frequencies of the observed and missing/imputed values.
- main, sub
main and sub title.
- xlab, ylab
axis labels.
- axes
a logical indicating whether both axes should be drawn on the plot. Use graphical parameter
"xaxt"or"yaxt"to suppress just one of the axes.- frame.plot
a logical indicating whether a box should be drawn around the plot.
- labels
a vector of length three giving the axis labels for the regions for observed, missing and imputed values (see ‘Details’).
- ...
further graphical parameters to be passed down (see
graphics::par()).
Details
The amount of observed and missing/imputed values is visualized by jittered points. Thereby the plot region is divided into up to four regions according to the existence of missing/imputed values in one or both variables. In addition, the amount of observed and missing/imputed values can be represented by a number.
Note
Some of the argument names and positions have changed with version 1.3
due to extended functionality and for more consistency with other plot
functions in VIM. For back compatibility, the argument
cex.text can still be supplied to ...{} and is handled
correctly. Nevertheless, it is deprecated and no longer documented. Use
cex.numbers instead.
References
M. Templ, A. Alfons, P. Filzmoser (2012) Exploring incomplete data using visualization tools. Journal of Advances in Data Analysis and Classification, Online first. DOI: 10.1007/s11634-011-0102-y.
See also
Other plotting functions:
aggr(),
barMiss(),
histMiss(),
marginmatrix(),
marginplot(),
matrixplot(),
mosaicMiss(),
pairsVIM(),
parcoordMiss(),
pbox(),
scattMiss(),
scattmatrixMiss(),
spineMiss()