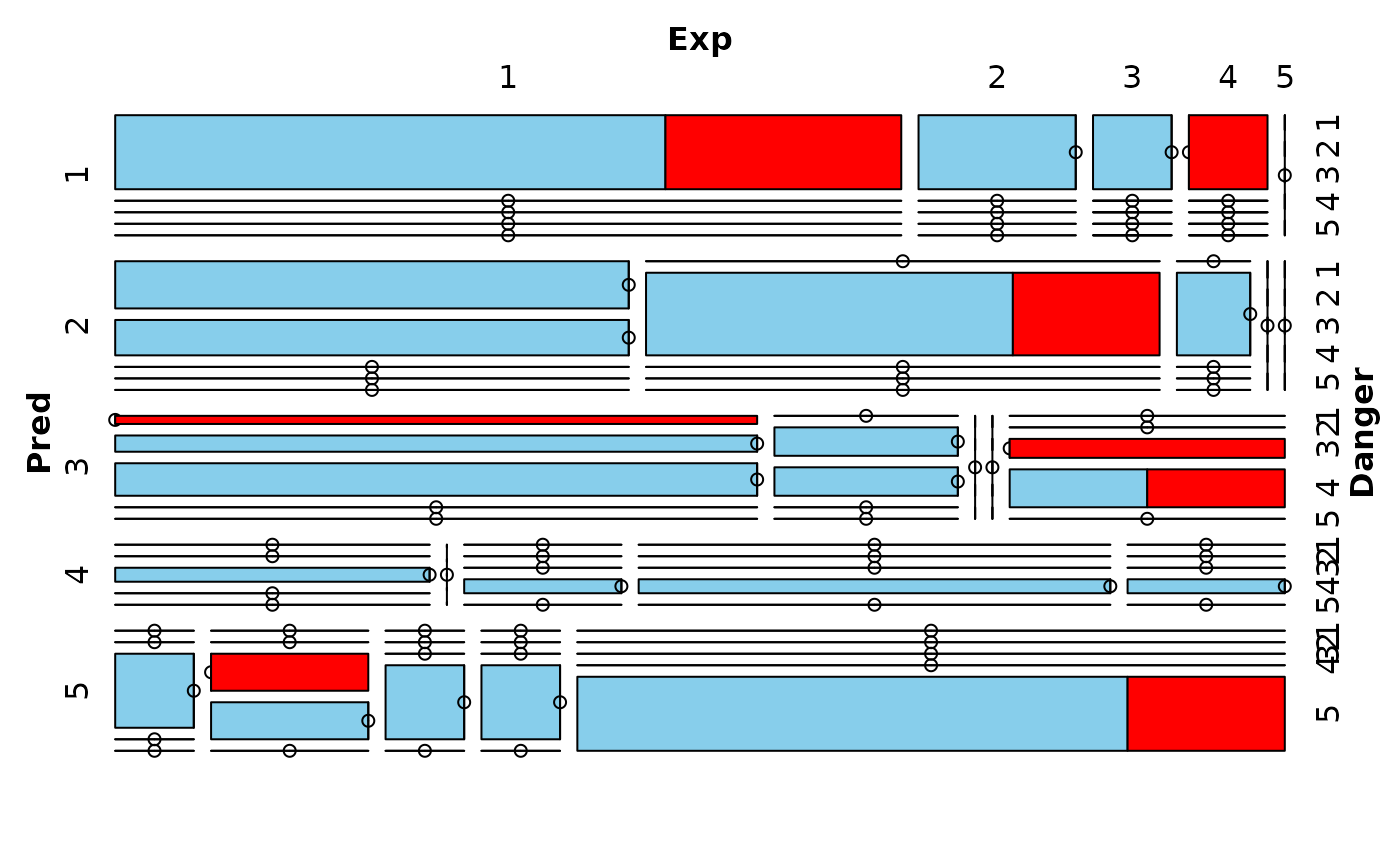
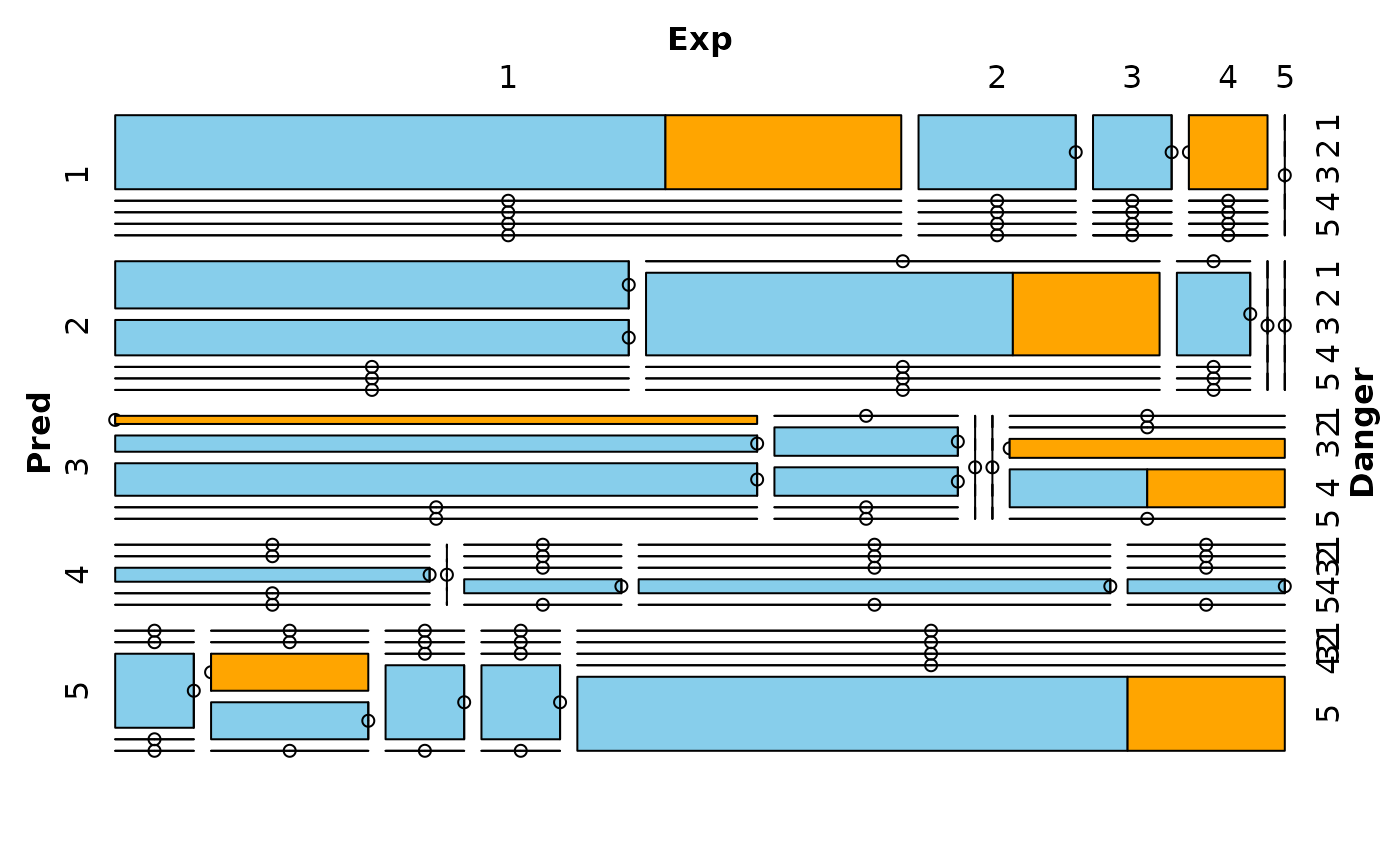
Create a mosaic plot with information about missing/imputed values.
Arguments
- x
a matrix or
data.frame.- delimiter
a character-vector to distinguish between variables and imputation-indices for imputed variables (therefore,
xneeds to havecolnames()). If given, it is used to determine the corresponding imputation-index for any imputed variable (a logical-vector indicating which values of the variable have been imputed). If such imputation-indices are found, they are used for highlighting and the colors are adjusted according to the given colors for imputed variables (seecol).- highlight
a vector giving the variables to be used for highlighting. If
NULL(the default), all variables are used for highlighting.- selection
the selection method for highlighting missing/imputed values in multiple highlight variables. Possible values are
"any"(highlighting of missing/imputed values in any of the highlight variables) and"all"(highlighting of missing/imputed values in all of the highlight variables).- plotvars
a vector giving the categorical variables to be plotted. If
NULL(the default), all variables are plotted.- col
a vector of length three giving the colors to be used for observed, missing and imputed data. If only one color is supplied, the tiles corresponding to observed data are transparent and the supplied color is used for highlighting.
- labels
a list of arguments for the labeling function
vcd::labeling_border().- miss.labels
either a logical indicating whether labels should be plotted for observed and missing/imputed (highlighted) data, or a character vector giving the labels.
- ...
additional arguments to be passed to
vcd::mosaic().
Value
An object of class "structable" is returned invisibly.
Details
Mosaic plots are graphical representations of multi-way contingency tables. The frequencies of the different cells are visualized by area-proportional rectangles (tiles). Additional tiles are be used to display the frequencies of missing/imputed values. Furthermore, missing/imputed values in a certain variable or combination of variables can be highlighted in order to explore their structure.
Note
This function uses the highly flexible strucplot framework of
package vcd.
References
Meyer, D., Zeileis, A. and Hornik, K. (2006) The
strucplot framework: Visualizing multi-way contingency tables with
vcd. Journal of Statistical Software, 17 (3), 1–48.
M. Templ, A. Alfons, P. Filzmoser (2012) Exploring incomplete data using visualization tools. Journal of Advances in Data Analysis and Classification, Online first. DOI: 10.1007/s11634-011-0102-y.
See also
Other plotting functions:
aggr(),
barMiss(),
histMiss(),
marginmatrix(),
marginplot(),
matrixplot(),
pairsVIM(),
parcoordMiss(),
pbox(),
scattJitt(),
scattMiss(),
scattmatrixMiss(),
spineMiss()