Create a scatterplot matrix with information about missing/imputed values in the plot margins of each panel.
marginmatrix(
  x,
  delimiter = NULL,
  col = c("skyblue", "red", "red4", "orange", "orange4"),
  alpha = NULL,
  ...
)
Arguments
- x
a matrix or
data.frame.- delimiter
a character-vector to distinguish between variables and imputation-indices for imputed variables (therefore,
xneeds to havecolnames()). If given, it is used to determine the corresponding imputation-index for any imputed variable (a logical-vector indicating which values of the variable have been imputed). If such imputation-indices are found, they are used for highlighting and the colors are adjusted according to the given colors for imputed variables (seecol).- col
a vector of length five giving the colors to be used in the marginplots in the off-diagonal panels. The first color is used for the scatterplot and the boxplots for the available data, the second/fourth color for the univariate scatterplots and boxplots for the missing/imputed values in one variable, and the third/fifth color for the frequency of missing/imputed values in both variables (see ‘Details’). If only one color is supplied, it is used for the bivariate and univariate scatterplots and the boxplots for missing/imputed values in one variable, whereas the boxplots for the available data are transparent. Else if two colors are supplied, the second one is recycled.
- alpha
a numeric value between 0 and 1 giving the level of transparency of the colors, or
NULL. This can be used to prevent overplotting.- ...
further arguments and graphical parameters to be passed to
pairsVIM()andmarginplot().par("oma")will be set appropriately unless supplied (seegraphics::par()).
Details
marginmatrix uses pairsVIM() with a panel function based
on marginplot().
The graphical parameter oma will be set unless supplied as an
argument.
References
M. Templ, A. Alfons, P. Filzmoser (2012) Exploring incomplete data using visualization tools. Journal of Advances in Data Analysis and Classification, Online first. DOI: 10.1007/s11634-011-0102-y.
See also
marginplot(), pairsVIM(),
scattmatrixMiss()
Other plotting functions:
aggr(),
barMiss(),
histMiss(),
marginplot(),
matrixplot(),
mosaicMiss(),
pairsVIM(),
parcoordMiss(),
pbox(),
scattJitt(),
scattMiss(),
scattmatrixMiss(),
spineMiss()
Examples
data(sleep, package = "VIM")
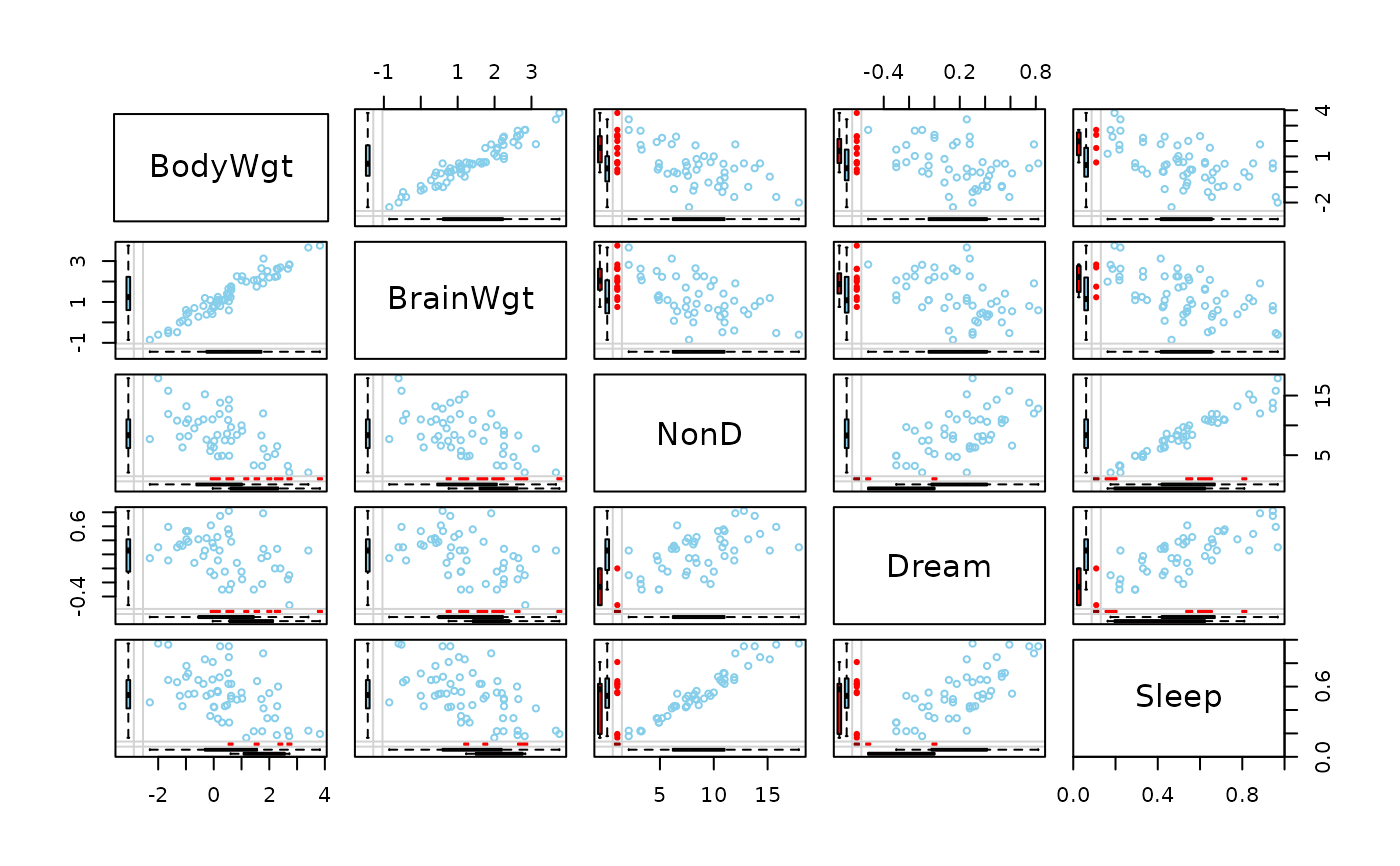
## for missing values
x <- sleep[, 1:5]
x[,c(1,2,4)] <- log10(x[,c(1,2,4)])
marginmatrix(x)
#> Warning: variable 'Dream' contains infinite values
#> Warning: 'x' contains infinite values
#> Warning: 'x' contains infinite values
#> Warning: 'x' contains infinite values
#> Warning: 'x' contains infinite values
#> Warning: 'x' contains infinite values
#> Warning: 'x' contains infinite values
#> Warning: 'x' contains infinite values
#> Warning: 'x' contains infinite values
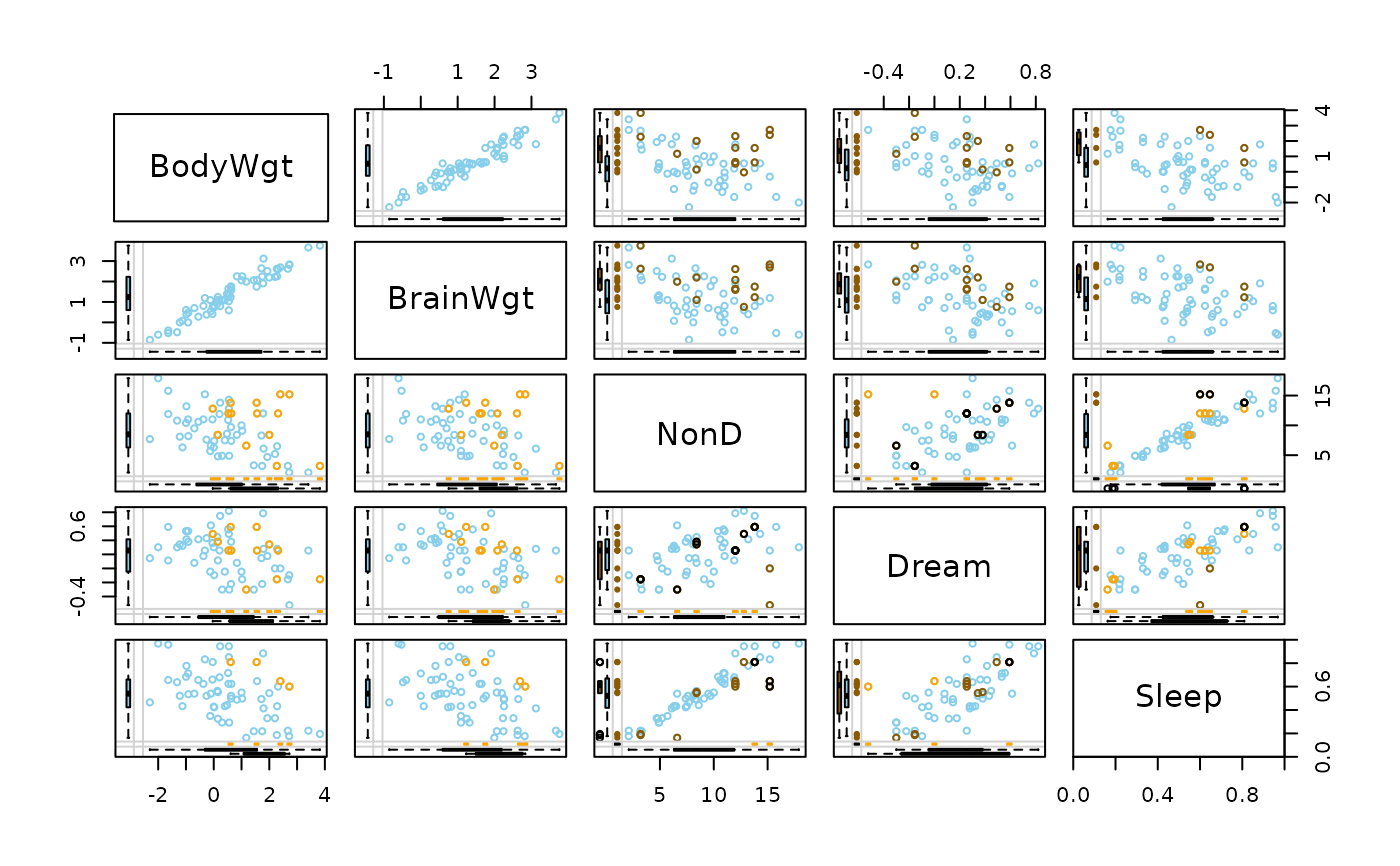
 ## for imputed values
x_imp <- kNN(sleep[, 1:5])
x_imp[,c(1,2,4)] <- log10(x_imp[,c(1,2,4)])
marginmatrix(x_imp, delimiter = "_imp")
#> Warning: variable 'Dream' contains infinite values
#> Warning: 'x' contains infinite values
#> Warning: 'x' contains infinite values
#> Warning: 'x' contains infinite values
#> Warning: 'x' contains infinite values
#> Warning: 'x' contains infinite values
#> Warning: 'x' contains infinite values
#> Warning: 'x' contains infinite values
#> Warning: 'x' contains infinite values
## for imputed values
x_imp <- kNN(sleep[, 1:5])
x_imp[,c(1,2,4)] <- log10(x_imp[,c(1,2,4)])
marginmatrix(x_imp, delimiter = "_imp")
#> Warning: variable 'Dream' contains infinite values
#> Warning: 'x' contains infinite values
#> Warning: 'x' contains infinite values
#> Warning: 'x' contains infinite values
#> Warning: 'x' contains infinite values
#> Warning: 'x' contains infinite values
#> Warning: 'x' contains infinite values
#> Warning: 'x' contains infinite values
#> Warning: 'x' contains infinite values